Thursday, July 19, 2012

Lab Instructions

Finished the lab instructions for my experiment with the help of Brian.


Making the Calibration Set:

1.     Know how much of each element you need to cover in the calibration set.  For my purposes we did between 0-0.5 ppm Mg, 0-1.2 ppm Na and P, and 1 ppm Co for 10 mL of water.  Note:  See document 6-26-12 Calib Specs.xlsx .  If you do something different from this, use this formula to calculate how much you will need for your calibrations:
(Required ppm*Required Volume)/(Stock’s ppm)

For example:
I have 50 ppm stock of Mg and want 0.5 ppm Mg in 10 mL of water. 
Calculate:
(0.5 ppm*10,000 micro liters)/(50 ppm)=100 micro liters of Mg soln. needed in my calibration

2.     Please use the 50 ppm stock, if there isn’t enough make more.  Believe me, you do not want to be struggling with 1 and 2 micro liters, working with smaller amounts increases your percent error. 
3.     Use my document, already named above, as a template for your calibration specifications.  Just save as!  I have the spreadsheet set up so it will calculate your final, actual concentrations of each element in your calibrations, which you will need to put into the Method in Winlab for analysis. 
4.     Now just follow the steps in the spreadsheet.  Weigh tubes before and after you add solution and check the percent error before you move on, sometimes you’ll have to re-due one!
5.     Most importantly, run the calibration set in the spectrometer before you use it for analysis.  For 10 mL of calibration, you can run the machine about 4 times.  Look at the correlation in the calibration set, if everything is 0.99-0.999 then you are good to go!  A great calibration set makes a world of difference in the analysis.

Making the Sample Set:

1.     If you have made the calibrations, this is pretty self-explanatory.  Use document 6-27 Sample Specs.xlsx.  This is the template for the same samples I made.  It tells you have much NaCl, MgCl2, Tris, and water to add for 5 ml samples.  The specs on these samples are:
0, 0.5, 1, 2, 3 mM MgCl2
10 mM NaCl in each
1 ppm Tris
2.     Again, this spread sheet is set up to give you your final, actual amounts of element in each sample.  Use this as a point of comparison in the analysis, after you get your data, just to make sure everything came out as it was supposed to.
3.     Now move onto the cold room for spinning!

Spinning Samples in Centrifuge 5418:
Note: Spin samples in the cold room in the science center.

1. Take centrifugal filter tubes and put filters inside of them.
2. Pipette 200 μL of NCP into top of tube.
3. Open centrifuge. Unlock and remove lid by twisting counterclockwise.
4. Put your tubes inside holes.
5. Balance tubes in the centrifuge. For example, if you place another tube in location 1, there also needs to be another tube in location 10. There always needs to be an even numbers of tubes. If there is an odd number, fill another tube with the same amount of water.
6. When there are more than two tubes, the tubes need to be exactly opposite from each other. For example, use locations 1, 2, 10 and 11 instead of locations 1, 6, 10 and 15.
7. Put lock back on. Close lid.
8. Set timer to 10 minutes and RCF to 14000.
9. Hit start. Make sure the centrifuge gets up to speed. Hit stop if the centrifuge starts vibrating and check locations of samples to make sure they are evenly spaced.
10. Wait until spinning ends and lid pops up.
11. Remove tubes. Pipette out liquid from bottom of tubes. Be sure not to contaminate filters.
12. Put filters back in tubes.
13. Pipette 400 μL of sample into top of tube.
14. Spin again and repeat until 8 spins have been completed. After the 7th and 8th spin, collect liquid from bottom of tubes in separate tubes. Weigh these tubes before and after pipetting into them.
15. After the last spin, it is necessary to collect whatever is still in the filters. Weigh new tubes. Flip the filters into these new tubes. Put these tubes back into centrifuge. The caps will not fit into the tubes. Place them toward the center of the centrifuge.
16. Spin again for 2 minutes at 2000 RCF.
17. Keep the remaining solution.

The Analysis:

1.     Make the samples to be run in the spectrometer.  There should be four sets of 5 tubes each.  The leftover NCP, Spin 7, Spin 8, and Buffer.  Make sure to record the masses of how much sample and water you add to each tube.  As a guideline, dilute about 50 micro-liters to 5 mL of water. 
2.     Run sample in the spectrometer.  See the instructions next to the desktop computer if you don’t know how to use the instrument already.
3.     Export the data set.  Use template called “Lauren’s”.
4.     Copy and paste your data into the “Raw Data” tab of the NCP Trial Template.xlsx *note delete the repeated concentration column, you won’t need that column twice
5.     Next copy and paste the raw data into their respected tabs, sorted by analyte.  This takes a little while to do the first time, but gets easier each time you do it.
6.     In the “Dilutions” tab enter the mass of the sample and water in each tube for the respected sets.  Then copy and paste the concentrations column of each set into the Dilutions sheet.  Everything will be calculated for you.
7.     Copy->Paste Special the “Average P” values from column J to column K in the “Ion Count” tab.  Column labeled “Average Org. Conc. (mM).
8.     Copy-> Paste Special column I for each set into their respected columns in the “Ion Count” tab.  *Note you don’t need the concentrations from the phosphorus copied, just the sodium and magnesium
9.     Onto the graphs.  Graph the original buffer concentration of the magnesium vs the excess buffer ions per Nucleosome of the sodium and magnesium.  For this part, just pick one of the analytes to graph and remember which one you used to calculate the error bars.
10.  Lastly error bars.  Not going to lie to you here, I can’t give you much guidance.  If you figure out what is on the spreadsheet, kudos.  Otherwise just start from the beginning and go through all the calculations with the standard deviations.  Remember to add in quadrature when you multiply and divide!  For this step I always have to go back and write out what I did, since I can’t seem to come up with a good system of just plugging things in. 
11.  Check out your graph.  How well did your trial go?

Week 7 Day 4

Today, I decided to try to redo my experiment but with different concentrations of MgCl. After making the samples, the concetrations are 0, 1, 10, 12, and 50 mM. I ran out of nucleosomes while making the last sample so sample 3 has only 15 microliters of NCP rather than 41. After making the samples, I spun them and pipetted out the top and bottom into separate tubes. I am ready to run the samples again when we have gas.

Week 7 Day 4

As with all science, you can't just do an experiment once to prove a hypothesis.  So today I made another set of samples just like the last set, to repeat the experiment and see if I can get the same results. Of course I don't anticipate having the same problems with the scale again, so I think this next run will go smoother and I can get results quicker!

Week 7 Day 3

I analyzed all of my data from my experiment and I calculated the difference in Na, Mg, and P from the top of my samples vs. the bottom of my samples. The Mg and P have small differences in the samples with no MgCl(sample 1) and 50 mM MgCl(sample 4). They have much larger differences with 5(sample 2) and 10 mM MgCl(sample 3). The Na has an odd trend.

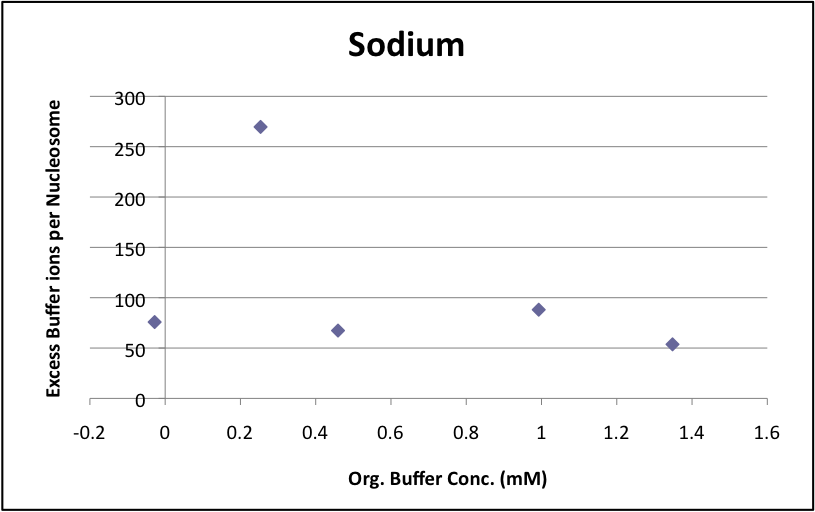
Here are the graphs of Sodium 589.592, Mg 279.553, and P 178.221. When finding the differences, I took the absolute value. The error bars are too small to be seen. The y axis has units of mM.


Wednesday, July 18, 2012

Week 7 Days 1/2/3

So far been a pretty slow week, but with good results :)  Monday I waited for the gas guys to come, then purged the instrument all afternoon.  In the evening I ran the samples from last week.

Tuesday I reviewed the data.  Unfortunately back when we made the samples the scale freaked out and started spitting out weird numbers, so I when I put those masses back into the analysis I got back all negative ion counts.  Obviously something went wrong there.  Fortunately the scale was fine when we made the buffer samples, and we don't really care about the Spin 7/8 samples for the graph.  Plus I had enough nucleosomes left to make up another set of NCP samples to run.  So thats what I did.  I made the samples and we had enough argon left to run the spectrometer again.

Today I came in and reviewed the corrected data, and it looks beautiful!  Tiny error bars and the correct trend.  To bad Andresen isn't here to (celebrate? can we do that yet?) and look over the data.  Here are the graphs though, what do you think?


Monday, July 16, 2012

Week 7 Day 1

Today I started on a new project. I started by making samples which will be finished tomorrow, then spun and ran in the spectrometer. I am going to be measuring the difference in NCP concentrations at the top of our solutions and the bottom of our solutions. The samples I made today consisted of 1 mM Trs, 10 mM NaCl, 0,0.5, 1, and 5 mM MgCl and 1 mg/ml of NCPs.

Thursday, July 12, 2012

Week 6 Day 3 and 4

Wednesday we made up the samples and were going to run them, but we are out of gas.  Will have to wait to run till Monday or Tuesday.  Instead we made presentations to show andresen and started to write up Lab Instructions for my experiment.

Thursday we presented the presentations, got a little feedback, and Brian moved on to a new project.  I made up some calibration sets with Chloride and Bromine to determine whether the spectrometer can measure those elements.  Once again we do not have gas to run the spectrometer, so will have to wait to look at those sets until next week.

Tuesday, July 10, 2012

Week 6 Day 2

Today Brian and I continued with the next step of our experiment.  We took turns every ten minutes going into the cold room in the Science Center to do the spinning.  The experiment seems to have gone well.  We will know more tomorrow when we send the samples through the spectrometer.  We were also visited by Dan with questions as to why we were so bundled up on a hot summer day.

Week 6 Day 2

We came in this afternoon and went to the science center to spin our samples in the cold room. It was cold. We will run the samples in the Spectrometer tomorrow.

Monday, July 9, 2012

Einstein Has Joined the Lab

Einstein has come to live in our lab and is a nice distraction with all the sets of clothes he came with.


Week 6 Day 1

Back from break.  Just before we left, we found out that I added phosphorus to the samples and should not have because the nucleosomes already had them.  So this is what messed up our last run.  So today Brian and I remade the samples without the phosphorus.  After we spin them in the cold room tomorrow we will add the 1 ppm Co standard.  Then into the spectrometer on Wednesday!  Hopefully this run comes out perfect.

Here is a fun picture of our samples


Week 6 Day 1

After a week off, Lauren and I came in this afternoon to resume our experiments. We are planning on redoing our experiment from 2 weeks ago. Today we made samples with MgCl, NaCl and Trs. We did not include P. Adding P messed up our results last time. We are planning to spin the samples tomorrow and will run the samples on Wednesday in the spectrometer. To prepare for this, we also labeled and weighed tubes for tomorrow. We will keep the sample after Spin 7, Spin 8, and after we flip our filters.

Thursday, June 28, 2012

Week 5 Day 4

This morning Brian and I made the diluted samples of the spin 7, spin 8, NCP, and Buffer.  Then we ran them in the spectrometer.  After lunch I analyzed the data.  Not really sure what I should conclude from it, but Andresen can help with that tomorrow morning.  Here are the graph's I got, though.  Error bars are shown, but many of them are small enough that you can't see them.  I do think it is a problem that we have such small counts in the magnesium, but the sodium seems fine.


Week five day four

This morning, Lauren and I finished diluting our samples from the spinning yesterday and ran them in the spectrometer. After lunch, she analyzed the data while I started on a new calibration set. We still have enough of the previous set for a few more runs. The percent errors on the new set are very low so hopefully it will be as good as the previous set.

Wednesday, June 27, 2012

Week 5 Day 3

This morning I looked a the data from the last test run.  It came out really well, all the concentrations were consistent with each other, percent errors were low.  So we decided to do the real run aka same experiment just adding nucleosomes.  So Brian and I made up new samples and spent the afternoon spinning them.  We decided to keep the calibration set from last time, because there is enough for a few more runs and as you could see from the picture, very correlated!  Not enough time to run the spectrometer today, but we'll do that tomorrow and see how everything went.

Week 5 Day 3

This morning I read an article about DNA condensation while Lauren analyzed the data from yesterday. After discussing her findings with Prof. Andresen, we started making samples to run an actual experiment with. After lunch we went to the cold room to spin these samples. We spun 8 times, collecting the sample after spin 7, spin 8, and after we flipped the filter.

Tuesday, June 26, 2012

Semajno kvin tagon du

This morning I went to the cold room in the science center to spin samples. This took me up until lunch. After lunch, I finished making these samples to be run in the spectrometer. I collected the spin through liquid from spins 7 and 8. I also collected what was left in the tubes after all the spins. We will see the results of the samples tomorrow.

This correlation made me cry tears of joy


This picture deserves a post of it's own.  Except for that one point, this is the most beautiful correlation I have ever made with the spectrometer.

Monday, June 25, 2012

Week 5 Day 1

Fairly calm day.  Went over the data this morning.  The Spin 7 and Buffer samples came back consistent with each other.  However the left over samples were incredibly high, way too high.  I'm pretty sure it's because I messed up that part, when I flipped the filter for the spin I accidentally put it in the same tube, not a new one.  Also I forgot to do a spin 8....incidentally Brian and I spent the afternoon making new samples and calibrations.  We ran the calibrations to make sure there were ok, but it looks like we'll have to re-do them tomorrow morning, since the magnesium and phosphorus correlation weren't very good.  And tomorrow we are going to go to the cold room again and do the experiment right this time.  (And also bring a sweater ^_^)

Week 4 Day 5

Friday was fairly uneventful.  This morning I ran the samples in the centrifuge in the cold room.  I was very cold, but managed to get it done before lunch.  Realized I should have run the spin one more time to get the spin 8 samples, so I only have the leftover sample, spin 7, and buffer to run in the spectrometer.  Ran the spectrometer in the afternoon.  Will start analyzing data Monday.

Friday, June 22, 2012

septimana quattuor die quinque

This morning I ran calibrations in the spectrometer to make sure they were good enough to run samples. The results were good. So in the afternoon, I helped Lauren prepare samples. Then we ran the spectrometer. We will look at the results on Monday.

Thursday, June 21, 2012

Week 4 Days 3 and 4

So yesterday I ran three more trials on the spectrometer to measure Sodium.  After running about half the trials, I realized I put 1/10 the amount of cobalt I should have.  No worries, I just took out the internal standard in the analysis part!  Got back 2.81% error of the 0.6 ppm sample and 2.29% error on the 0.8 ppm sample.   That was after averaging all the data together.  Not too shabby!

 
Sample ID  
Calc Conc    Actual Conc SD               % Error


Average        
Sam 1 NaCo 0.5811 0.598 0.005   2.812361468
Sam 2 NaCo 0.8173 0.799 0.00636 -2.29319108


ps, can't get the formatting on that right....

So today we moved on to doing a trial run with out the nucleosomes.  Basically making up the samples to be spun and then run in the spectrometer and the calibration set.  I struggled all day with the calibrations and the pipets... But it's all ready to be run tomorrow!

ceithre seachtaine ceithre lá

This morning Professor Andresen and I put the samples into the gel. Then we plugged it into a power source and let it run for a few hours. After lunch, we went to the science center. We put the gel into ethidium bromide. After we rinsed off the excess, we put it into another machine to see what the samples did. It turned out that our nucleosome supply is still mostly good.
When we got back I helped Lauren on her project by making her buffers.

Tuesday, June 19, 2012

וואָך פיר טאָג צוויי

Professor Andresen was out of town today. I read about electrophoresis. It was confusing, but I think it will become much clearer when I am shown how to do it. I also helped empty out the cabinet on the first floor of Masters.

Week 4 Day 2

Today I ran two trials in the spectrometer.  After looking at the data, I realized I completely botched the calibrations for set 5, but set 6 was fine.  This completely threw off the data for set 5, but set 6 was consistent with the data I took on Friday.  After looking at the errors and correlations, I have determined that our machine is just bad at measuring very small concentrations.  What we can do is make sure our calibration sets are dead on, because that improves error significantly.  Also getting the internal standard in the sample right on seems to help.  But with the lowest concentration of sodium, I'm still getting a 20% error.  The other concentrations are almost all in the single digits for percent error.  I'm hoping that when we actually take data, we can run the calibration first, look at the correlation in sodium and decide of its going to be good enough to run with the samples.  We'll just have to make enough to run the calibration set twice if need be.

Monday, June 18, 2012

Week 4 Day 1

After looking over the sodium trials data from Friday and knowing the fact that when we take away the calibration constant from analyzing the data, Andresen and I decided to run the Sodium trials again, this time still using the highly concentrated NaCl solution and diluting it down, but this time making a diluted sample of Co.  We are doing this because the analysis of the data seems to be very dependent on a very good calibration constant, the cobalt.  So if we dilute it, then take a lot of it to get the same concentration in our samples as we did before, then it will be easier to get the exact amount of cobalt.  So I made that dilution, then made two more sets of sample and two more sets of calibrations.  All ready to run and analyze tomorrow.

Четири недеље један дан

This morning I ran my samples in the Spectrometer. The pattern of my results looked good. The sample that contained Mg consistently had more Mg than the sample without Mg. The second sample contained less P which it was supposed to. However the data was consistently off by a factor of about 10. In the afternoon, I ran the excess liquid from the centrifuge in the second spectrometer to see where the nucleosomes went. Most fell out of the samples during the first spin.

Friday, June 15, 2012

ہفتے میں تین دن پانچ

This morning I finished my calibration samples. I also noticed a mistake in my buffers so I had to remake them too. After I did this we had our group meeting in the physics lounge. Dr. Good had some Good pizza. After lunch I put nucleosomes in new samples and spun them in the centrifuge with my buffers and then water. I did four spins with the buffers and 5 spins with the water. The water was supposed to only be 4 spins but I accidentally spun them a fifth time. When I retrieved my solutions after spinning, I weighed to find the amount of nucleosomes. My first sample had .0232g and my second sample had .0044g. This seems like a very large separation. I also added cobalt as an internal standard to the solution and filled up to 6 ml with water.

Week 3 Day 5

Today we decided to remake the sodium samples and run them again, since it seemed that there was such high correlation in my trial runs that did not match my expected values.  So thats what I did.  I re-made the samples this time by first making a concentrated solutions and then diluting it down to the concentrations I wanted.  At thank god it mostly worked.  My percent errors went down significantly.  A good way to end a Friday!  Of course, I'll see if I can play around with this sodium data a little bit more to see if there is a trick with getting the error lower.  Till funday monday!

Thursday, June 14, 2012

Týden tři dny čtyři

This morning I ran the spectrometer. When I got the results they were all over the place. However I forgot to account for the fact that there was no Cobalt as an internal standard for my nucleosome solutions. After I did this, the data did not look good so we are going to run the experiment again. This time I will keep the liquid that comes out during spinning. We will look at this to see if the nucleosomes come out of the solution. In the afternoon I remade the buffer solutions and started remaking the calibration samples. Tomorrow I will finish the samples and spin them.

Week 3 Day 4; Sodium has it in for me

So today I ran three of those tests I was working on with the sodium.  Didn't even bother running the 4th because we were getting consistent data....that didn't match our actual concentration.  We tried analyzing it the normal way, and by taking away the calibration.  That didn't help.  So possibly it is because I calculated the concentrations in my sample wrong, since the spectrometer DID give us consistent calculated concentrations across trials.  So now I'm going to do a weighted average of each wavelength and sample to get one graph with error bars.  Then I am going to try remaking my samples to see if that was an issue.  I'm also thinking in spare time to do a little internet research...there must be some other frustrated scientist out there working with this piece of equipment who had the same issue and found a solution.....

Wednesday, June 13, 2012

Color Coding FTW

sorry about not posting yesterday.  Basically what I did for the past two days was make up one large set of samples and 4 sets of calibrations.  Took a long time.  What we want to know is exactly how well our spectrometer measures sodium, since so far it doesn't seem very good.  I made up large samples with NaCl concentrations and cobalt and then calibrations with Na and Co.  I then ran the first of the four sets we will run.  Haven't looked at the data yet, but seeing as Brian and I are sharing the spectrometer tomorrow, I'll have time to review it then.

A note about my awesome color coding skills.  All the stands that the sample and calibration tubes are set in match the color strip in its corresponding excel document :D how's that for organization?

Uke tre Dag tre

Today I spun my samples in the centrifuge for the first time. I spun the nucleosomes 4 times with the samples I made a few days ago. Then I spun the nuclesomes with water 12 times. This took me until past lunchtime. After a spun the samples I put them into tubes and put in about 6 ml of water. Tomorrow I will run the samples in the spectrometer. I would've done that today but Lauren was using it.

Tuesday, June 12, 2012

Week3Day2

This morning I made the axial align solution for the spectrometer. In the afternoon I ran the spectrometer with the samples I made yesterday.

The data came out well except for the sodium. The correlation coefficient was around 0.916 after initial reprocessing. I tried to fix the data by deleting sample 2. This sample had 0.049 ppm of Na. The spectrometer read it as having negative sodium. However the data did not look any better after deleting the point. The correlation coefficient was 0.90. Na 589.592 gave the worst data. It gave a negative value for Na when there was 0.33 ppm in the sample.

The correlation coefficients of the Mg and P were better. The Mg was about 0.98 and the P was greater than 0.990.

Monday, June 11, 2012

Week3day1

This morning I made the buffer solutions. I made 4 of them. In the afternoon I had to make more calibration samples because I made a mistake in my previous ones. I also added Na to these samples.

Week 3 Day 1

Today I continued to analyze data.  Fixed problems andresen found within my excel spreadsheets, and then spent the afternoon on error propagation.  Long tedious work to say the least, and it is almost completely impossible to come up with a way of organizing the error propagation steps in an excel spreadsheet, but i'll take another stab at that tomorrow when i'm fresh.

Friday, June 8, 2012

Week 2 Day 5

This morning I finished making the excel spreadsheets from yesterday pretty.  Also doubled the NCP dilutions for the mM concentrations because originally AP and KA diluted it to 200 ml instead of 100 ml accidentally.  Next I found the excess ions per nucleosome.  For this calculation the average P was the average of the two P data sets from the NCP data.  At the end of the morning we had a department meeting just to share with everyone what we are doing this summer.  In the afternoon I went over the data with Andresen.  It looks like it isn't good.  As the Na decreases, the Mg should increase.  But according to the data the Na and Mg increase together.  So I moved on to the second set of data.  File labeled Nucleosome Trial 4-AP.  I followed the same steps as last time, except this time I already had the excel spread sheets, so I just copy pasted stuff in and then made it look pretty.  Will talk about the results with Andresen on monday.

Week2Day5

This morning I ran my samples from yesterday in the spectrometer. My results showed that the Spectrometer will give good results at 0.1ppm Mg. In the afternoon I made more samples of the same elements. Next week I will make a buffer with 0, 1, 2 and 3 mM Mg and 1 mM Na-Trs.

Thursday, June 7, 2012

Week 2 Day 4

First things first:  We have accepted a challenge to play laser tag.  Andresen's Lab vs. Thompson's Lab.

And the less (actually more) important aspects of the day...
Started out the first hour working on organizing the data from our samples run on tuesday while Brian talked to Andresen.  Then I had my hour with Andresen to talk about my project.  We looked over Alicia's data and talked about how I should go about the analysis.  The from the end of the morning through till 5 I worked with the Method in Winlab called Nucleosome Trial-AP.  To make the data more correlated I weighted the lower points more and took out point 7.  Then I exported the data and spent the afternoon organizing it.  See notebook and document named NucleosomeTrial-APc for the extensive data.  The last thing I did was set up an excel document to convert the diluted sample concentration to the original concentration.  Will continue analysis tomorrow.

Wednesday, June 6, 2012

Week 2 Day 3

Today we ran a second test.  This morning we ran the spectrometer and the samples.  Brian and I set up the machine and computer by ourselves, getting used to the program.  This afternoon we looked at our data.  My data came out much better than yesterday.  The control seems to still have a little magnesium, but barely as much as yesterday.  Also we ran all of our samples on axial, so my sodium came out very correlated this time.  Unlike yesterday we got some really bad data for it.  Then we spent the rest of the afternoon continuing to play with the program and figuring out how to export data.  It's really not a program that is intuitive at all.  Brian and I spent minutes staring at the screen going "wait...what just happened?"  The prime of this computer programming comes with me saving my re-calibrated data and WinLab deleting Brian's simultaneously.  Thankfully he only had to make up 2 minutes worth of work.  Finally got my data into excel with everything I could want.  Will continue to clean it up and organize to my liking.

Week 2 Day 3

This morning Lauren and I ran the samples we made yesterday as well as the samples from last week. This took us the entire morning. After lunch we started to analyze this data. We saw that I accidentally made 2 samples of the same thing. The sample which was supposed to contain only water and cobalt also had P, Mg, and Mn in it as well. We were able to get around this by using one of Lauren's data points. We tried to learn how to export our data to excel and it gave us a lot of trouble. Eventually we got Professor Andresen to help us. Overall, Lauren and I learned a lot about using the spectrometer and the computer program without Professor Andresen guiding us through step by step. Tomorrow we will be further introduced to our individual projects and will being to work on them. We hope to have data by the end of next week.

Tuesday, June 5, 2012

Week 2 Day 2

Today, Professor Andresen showed us how to use the spectrometer. We put in our samples in the morning and ran the machine until lunch. After lunch, we analyzed the data we got. At around 4, we realized the machine used a lot of some of our samples so we had to make new ones. I had to make 3 new samples.

Week 2 Day 2

Today we learned how to use the spectrometer and ran the samples we made last week.  My control sample came up with some magnesium that should not have been there and all of the sodium gave weird data.  However it was a good trial run, learning how to use the machine, and analyze it.  We will run it again tomorrow, so in the late afternoon we made up more samples of 1, 5 and 10 to replace the lack of sample left over after today's run.  Also, we will see if my control sample was just contaminated by running the new control (sample 1) tomorrow.  If thats not the issue then maybe it's the distilled water?  I'm thinking it's not because the rest of the samples did not come up with a really high magnesium count.

Until tomorrow team America.

Monday, June 4, 2012

Week 2 Day 1

Team America here.  Brian named us this after reading some of Fasch and Ben's posts from last summer, who called themselves the Internationals.  This morning we started out coming up with questions to guide our continued reading about our projects.

Clarification/ Reading Questions:
1.  Explain Poisson-Boltzmann Mean Field Theory
2.  Explain Figure 4 in the Bai article.  What is the upside down triangle symbol?
3.  What do the different histones do?  H1?
4.  What exactly is "nucleic acid thermodynamics"?
5.  Gelbart pg 39.  Help visualize attraction of macro ions.

Big Picture Questions:
1.  What work has been done on this project before me?
2.  Why do we use Na+ and Mg2+ ions in the experiment?
3.  Why are our ions all cations?
4.  What are the histone tails?
5.  Do the tails only come out when the chromatin is unwrapped, do we have to unwrap them first?

We also talked about what we learned so far and Brian and I explained to each other what each of our projects would be.  Then this afternoon we held a Team meeting.  Discussed the questions, got answers, and talked about what we learned and what else we could read articles about.  Goal for the end of the week: read 5 more articles.

Team America out.

Week 2 Day 1

This morning, after a brief meeting with Professor Andresen, Lauren and I compiled a list of the things we learned from the readings last week. We also made two lists of questions we wanted to get answered. The first list was made up of specific terms and graphs from the readings we were confused about and the second list contained bigger picture questions. When we had compiled all our questions we read for the rest of the morning. After lunch, we met with Professor Andresen to discuss our questions. Our meeting lasted approximately two hours. After the meeting we read more articles to finish out the day. Tomorrow we will start working in the lab.

Thursday, May 31, 2012

Week 1 Day 3

This morning we continued to make our calibration samples.  I had a lot of trouble getting the correct amount of phosphorus, since it was such a tiny amount to measure.  I had to do one of the samples 4 times before I got the amount of phosphorus at a reasonable percent error.  Then I helped brian make one of his samples that he was having trouble with as well.  After lunch, we calculated the adjusted concentrations in our calibration samples.  Then we read about and learned about the computer program and the spectrometry machine we will be using to analyze samples throughout the summer.  Finished up with the day with a meeting with Prof. Andresen about the actual projects we will undertake this summer.  Mine is a continuation of his previous research.  Basically figuring out whether or not the tails that come off of nucleosomes are wrapped or not.  I will be working on getting those error bars down to reasonable sizes.

Week 1 Day 3

Today, Lauren and I finished our calibration samples in the morning. We tried to reduce our errors as much as possible. After lunch, we figured out the adjusted concentrations in our samples. When we both finished, we were introduced to the spectrometer. However we had trouble with the computer system. Lauren and I both met with Professor Andresen individually and he told us what experiments he has planned for us this summer. To finish the day, Lauren and I read more articles.

Week 1 Day 2

This morning we continued to read articles and catch up on latest research in the field.  Then in the afternoon we started making calibration samples.  I am making 10 samples, each 10 mL.  They each have 1 ppm of Co, 0-5 ppm of Mg and Na, and 0-1 ppm of P.  The rest of the sample is water.  I started out with the water.  Came out fine on the percent errors.  However I had to redo three of the samples next, when I added the Co.  Third, I added the Na.  Some of the percent errors were a little high, but not high enough to redo the samples.  Today I will finish adding the Mg and P.

Week 1 Day 2

 Yesterday, Lauren and I read again in the morning. In the afternoon, we went back into the lab. We started making samples to put in the spectrometer. I started 11 samples. They all contained 1 ppm of Co. The rest will range from 0-5 ppm of Mg and Mn. They will all contain 0-1 ppm of P. So far I have put in the water, the Co, and the P.

Wednesday, May 30, 2012

Week 1 Day 1

Today we started by reading a paper from Physics Today titled DNA-Inspired Electrostatics and by doing some textbook reading to catch up on basic biology and biochemistry.  In the afternoon Brian and I learned how to pipet properly.  We practiced getting the correct amount of water in 1.5 mL sample tubes with each of the six pipets.  After we were done, I had less than a 1% error in the majority of my measurements.  However I had significant errors in the 2 and 10  microliter pipets.  So I remeasured the water for those pipets.  After this second try I got much smaller errors in my measurements.  At 4 pm we went to the Lab Safety Training and then called it a day.

Week 1 Day 1


Lauren and I started our summer research yesterday. We were given an article about DNA-inspired electrostatics to read. Professor Andresen also gave us numerous textbooks to read so we could learn basic biology and chemistry. In the afternoon, we went to the lab and worked on basic pipetting techniques. We were given the task of transferring water from one vial to 1.5 ml sample tubes.  My first attempt was not very good. However I was able to reduce my error bars on my second attempt.

Thursday, July 28, 2011

Week 10 - Day 3

Today, Ben and I finished working on our slides for our presentation to cap off the research. Based on suggestions from Prof Andresen and John, we made changes to our data arrangement and delivery. We did a practice session with John spotting out more ways to improve the presentation. We were finally ready but the end of the day and gave our presentation. I think it went pretty well and we are now assured that the rest of the Physics research have a good idea of what we did during the summer!

Tuesday, July 26, 2011

Week 10 - Day 2

We got the results today and it was another disappointment. The Na concentration was fluctuating while the Mg concentration seemed better but not still up to expectation. Professor Andresen decided to check the parts of the spectrometer again to see if there is any problem wrong with it and he also personally made some solutions to see what happens. Ben and I also started working on our slide show for the presentation we have tomorrow. We are gathering our data and doing some final analysis on them.

Week 10 - Day 1

Today, I made buffer solutions once again and tested them in the spectrometer. The results will be analyzed tomorrow as we are going to run it overnight.

Monday, July 25, 2011

Week 9 - Day 5

I remade the solutions using the right concentrations of Mg today. The results we great! What a sense of relief. All the prepared concentrations fell with 1% of their intended concentration. So we decided to step it up one notch. Professor Andresen suggested that I made more solutions in ppb But this time I should make two sets: One with only Mg diluted with water and then the other one with the complete components ( tris and Nacl). I made the solutions and stored them in the fridge so we could test them on Monday and analyze the results.

Week 9- Day 4

Today, we ran and analyzed the results of the solutions I made in ppb (parts per billion). There was another problem today as the results showed that there was no Mg in the solutions at all. I checked through my calculations and found out that my calculations were off by a decimal place which made my calculations for the Mg concentrations 1/10th of the actual values they should have been thereby making them undetectable by the spectrometer. I decided to repeat making the solutions tomorrow.

Week 9- Day 3

Today, we got the results for the solutions I made yesterday. We had both good and bad news. Good news first: The Na concentrations we almost on points as we had only two samples falling of the 10mM concentration it was supposed to be(7.9 & 7.7mM).The rest were about within 5% of the 10mM intended concentration. However, the bad news is that the Mg concentrations were all off by a factor of 7. This was surprising and confusing at the same time because I was pretty sure I did not multiply my calculations by any factor at all. So, the conclusion today was that I should make some solutions of just different Mg concentrations and water without the tris and NaCl. I made about 5 samples starting form an Mg concentration of 300ppb with an increase of 600ppb between solutions.

Week 9 - Day 2

Today, I took special care in making the solutions. I weighed them instead of the normal approach of just pippetting the needed volumes into test tubes. I also talked to Professor Andresen about possible problems with the whole experiment and we decided that we wait for the results of this run and then we can change our approach to making the buffer solutions.

Tuesday, July 19, 2011

Week 9- Day 1

After the little success we got, I decided to make more solutions today. However, the results are not looking good. The next step will have to be for me to weigh them instead of just relying on the pipette to measure the amount of solution that I put into the test tubes.

Monday, July 18, 2011

W9D1

Today I ran two large sets of samples, one for myself and one for Fash. Fash's samples were his latest set of buffers, for which we have high hopes. After fixing our problems last week, these results should be very consistent. We will look at the concentration data tomorrow. I finished running all of my Cohex 10mM series, and the preliminary results show a clear pattern. As expected, at high Mg concentrations, very little DNA precipitated, so the results are somewhat unreliable. Tomorrow I will double check the buffer solution, and begin to write up some summaries of our data.

Week 8

Last week was a busy week, which kept me from posting much. I'll try to give a somewhat decent account of what happened, and the status of our projects. Last week, we had some trouble getting consistent results from Fash's buffers. We investigated a variety of variables, from my calibration technique to pippetting errors. We also had a problem with counts from the spectrometer. We eventually discovered that part of our problem may have been coming from the plasma torch area being dirty. There was also a possible problem with consistent nitrogen flow. We now think we have most of the issues figured out, and should be able to proceed with collecting consistent results. Ben has been getting consistent buffer values, and is proceeding with his NCP experiments. For my project, last week I ran the second buffer solution, and began to test the actual samples. The second buffer solution had somewhat surprising concentrations, because they came out to consistently around 8 mM Cohex, when we thought they were 10. I am going to double check these results after I test the actual samples further.

Week 8- Day 5

I prepared more solutions today. But since John was leaving early today I kept them in the fridge so we could run them on Monday. Hopefully they turn out good!

Week 8 - Day 4

Today we tested johns results, and although they looked better than mine, they are not as close as we wanted them to be. So we were left wondering what was wrong with either the machine, the stocks or us! Well, we ruled the machine out because Ben's results were good. We were on the verge of ordering new stock solutions when professor Andresen decided to check the sprayer in the machine( spectrometer) and found out it was kind of clogged and worn out. He changed it with a new one and we hoped that as the problem with the machine. So I made some more solutions are we quickly tested them. Surprisingly we got really good results but there was a little problem because the measured concentrations of Mg we measured were in multiples of 10 of what I actually prepared. This might have been a mistake on my part so we decided to make more solutions tomorrow.

Week 8- Day 3

We tested and analyzed the samples I made yesterday. They still turned out random. So John and I decided that he made a few samples of his own so we could conclude if the problem was with my measurement or the stock solutions themselves. John made solutions with magnesium concentrations of 1mM and 2mM. We will test the results tomorrow.

Tuesday, July 12, 2011

Week 8 - Day 2

After the conference we each have some new assignments. Mine - to test the ionic attachment of Magnesium to NCP. It's simular to the last tasks, but a different method. Instead of adding Mg solutions of different concentrations to NCP, we are adding NCP to pre tested concentrations of Mg solutions, and testing the difference between the two. The goal is to get really careful and accurate data, so yesterday and today was spent working on the method. Yesterdays concentrations had a 6 sample standard divination of 1.4%, hopefully today's samples will be even less.

Week 8- Day 2

We analyzed yesterdays result in detail and decided I needed to make some new buffer solutions. I took more time and did it more carefully so the results should be a lot better than yesterday. We will analyze the results tomorrow.

Week 8- Day 1

After a week long break, we all gathered together today to discuss. Professor Andresen gave us a little briefing of how the conference went and he proceeded to let us know about future experiments we were going to carry out. The first problem we wanted to correct was the ability to make solutions to a good accuracy. So , I made buffer solutions of different Mg concentrations. If the results do not turn out well, I will have to make some more tomorrow too because we are gunning for perfection with this.

Sunday, July 3, 2011

Week 7- Day 5

Today was a short day for me with Ben and John away. I helped Professor Andresen sort out some articles for his conference. I also went through some of them as they had some relevance to what we are doing too.

Week 7- Day 4

Today, we got the results of the last test which turned out pretty well but with some unusual uncertainties. However, the got some good results on the concentrations at which the precipitation of the NCP occurs. I also helped Professor Andresen do some spins with some new NCP samples. The only difference with this samples was that the H3 and H4 tails were cut off from them. Professor Andresen was also preparing for his conference next week.

Thursday, June 30, 2011

W7D4

Today we looked at the latest results of the NCP experiment. These came out much better, and the concentrations were extremely consistent. They showed some interesting trends, mainly that there was a range where the Mg compensated for all the charge of the nucleosomes, but did not cause them to precipitate. Our main problem now is the large amount of uncertainty we are seeing. We will try to drive this uncertainty down with future tests.

W7D3

Today we analyzed the data from the NCP experiment. The results are still very inconsistent, and are not showing any clear trends. They are showing some inconsistencies in all of the concentration values. Because of this, we prepared for another test this evening, which we can look at tomorrow.

Week 7- Day 3

The results we got from running the two buffers where a little inconclusive due to some issues with the magnesium concentrations in the buffer I made and some other complications with Ben's buffer.But,we could still see the precipitation pattern of the NCP as the MG concentration increased. So Professor Andresen decided we needed to repeat the experiment to find out what as going wrong with it. However, this time, we spun the NCP eight times with the buffer because Professor Andresen suspected that the four spins we did for the last three experiments were not enough. We will analyze the results tomorrow and hopefully we get conclusive results this time.

Wednesday, June 29, 2011

W7D2

Today we had a pretty big day. We ran two sets of NCP experiments, which involved running the machine well into the night. We are having some problems with inconsistent Mg concentrations, which we hope to solve with future trials. We will be analyzing the data tomorrow, as well as preparing future trials.

W7D1

Today I ran two trials of the buffer solutions for the "5mM" Cohex series. The results leave me a little skeptic that the DNA was actually precipitated in 5mM, because all of the buffer solutions contained pretty exactly 3mM. This would explain why the Mg values only range from 0 to 50, which was the same range used for the 2mM series last summer. I will look into the other buffer solution later this week, to see if it contains 5mM or 10mM.

Tuesday, June 28, 2011

Week 7- Day 2

Today, we did got some good news and started working towards better news. Professor Andresen got the results of the gel he ran yesterday and found out that we had a good amount of NCP in our sample. Next, we found out that the test we ran with the spectrometer to monitor the ions present in our solutions was somewhat positive. There were a little off-concentrations in the solutions I made but ultimately, we noticed that the amount of phosphorus in the solution dropped steadily as the concentration of Mg in the solution increased. This is good news because it means that the NCP's are falling out of solution(condensing) as they contain phosphorus. To get better results, we decided to run the same tests again but this time with two different buffer solutions. The same one I made yesterday and a new one containing Tris and Nacl without Mg. We will analyze the results tomorrow.

Monday, June 27, 2011

Week 7 - Day 1


Today we got the NCPs ready to run in the spectrometer. Last week friday, we had a series of buffers with different concentrations of Mg in it for the eight different samples of NCP we were going to work on.First we spun down the NCP we had in a centrifuge three times in a buffer that contained MgCl. We then collected the NCP from the filter and tested the pH of the NCP to see if the buffer was effective and indeed it was because the concentration remained at 7.0. We diluted our eight magnesium samples, NCP, and and the buffer we used in the third spin by a dilution factor of 60. Then put them in the spectrometer so we could test the amount of Mg ions in each. We will analyze the results tomorrow. Here is a picture of the test paper we used. The yellowish colour represents neutral and as you can see , the first 8 dots represent our 8 samples and the bigger yellow dot represents de-ionized water which is neutral. Since they have the same colour,we can conclude that the buffers where neutral.

W6D5

Today I took a somewhat short day, with a planetarium show in the afternoon. In the morning, I tried to catch up on some reading. I read one article on the competition of monovalent anions, which was helpful because it tells us we can safely substitute out Chlorine for something that is more measurable. I also got ready to start running the buffer solutions, which will give us an exact look at the solutions in which our DNA was precipitated.

W6D4

Today I ran the remaining three trials of the 5mM series. These results confirmed that there is something wrong with the second and fourth samples, but other than that they were very consistent. The results were also strangely linear, which we saw some of in our results last summer.

Friday, June 24, 2011

Week 6- Day 5


Today, finally finished separating the di-nucleosomes from the mono-nucleosomes as I explained yesterday . Looking at the picture on the right,you can see some peaks on the graph . We are not sure yet which peaks represent what nucleosomes at this point but we suspect that the first pick to your right is where the mono- nucleosomes fall because a test using the UV based spectrometer showed a high concentration of NCP. We will run the different samples at each peak through the gel on Monday and then compare them again to the DNA ladder , so we can finally say for sure what we have.

Thursday, June 23, 2011

Week 6- Day 4


Today, we took a step ahead: getting the NCP to run through the gel almost perfectly. Looking at the picture beside, the first column is the DNA ladder and the bold band at the middle stands for 100 base pairs. But we need about 150 base pairs so we can count the bands after the 100bp band to see the 150bp mark because the bands in increments of 10. The next column stand for the NCP digest for 0 minutes, the next for 5minutes, then 10,20 up till 50 minutes. If you notice closely, there is a thick band on the same level of the 150bp on the 5minute digest column. This is an indication that 5 minutes was the adequate time to digest the NCP.We do not use the other columns because there is a lot of smearing of the whitish band and this indicates over digesting. Therefore we digested our NCP for only 5 minutes, and with the packing ready, we are currently running our NCP through it to separate the mono-nucleosomes from the di-nucleosomes using the size-exclusion chromatograhy technique. This way, the mono-nucleosomes we actually need run faster than the di-nucleosomes through the packing and we can collect them. The NCP has not finished running through but I will keep an eye on it till it does.

Wednesday, June 22, 2011

W6D3

Today I looked at the same 5mM Co series, but at a much higher concentration. Using the results I got from the dilute run, I designed a series that should encompass all the concentrations I will be seeing. After running at a higher concentration, the results look much more consistent. Actually, with the exception of the fourth sample, they look very clean and there is clear trend. It resembles the trends we were seeing last summer, but with the Mg taking longer to overcompensate for the Co. Tomorrow I will run three more trials to look at this series closely and get some averages.

W6D2

Today I spent the day looking at the 5mM Co series, which goes from 0 to 50mM Mg. I was somewhat unsure as to the concentrations of ions that I would find, so I made a very broad calibration series, and a 100X dilution of the samples to test this out. The results were pretty similar to the series I have run before, but with much more DNA. This makes sense, because our collaborator changed his procedure slightly and prepared the samples with more DNA. It is strange that we did not see an increase in the other ions as well, but it may have something to do with the initial conditions we are looking at for this series. Overall, this dilute run was somewhat unreliable, with particularly strange results for the fourth sample. Tomorrow I will use what I have learned about the concentrations to make a concentrated run.